A rectifier’s efficiency is straightforward: AC in, DC out, measured under a defined set of conditions. A telecom site’s electricity bill is not. It covers the radios and the cooling, but also battery charging and whatever else is drawing power that hour. Comparing the two only works if you draw a clear boundary around what you’re counting and use the same time window for both.
Before you measure anything, decide what you’re trying to improve. Lower conversion loss in the rectifiers, lower energy use across the site, fewer hours on the generator — these are different claims, calculated differently. Pick one, say it plainly, then list the measurements that would prove it.
Calculate the loss at an operating point
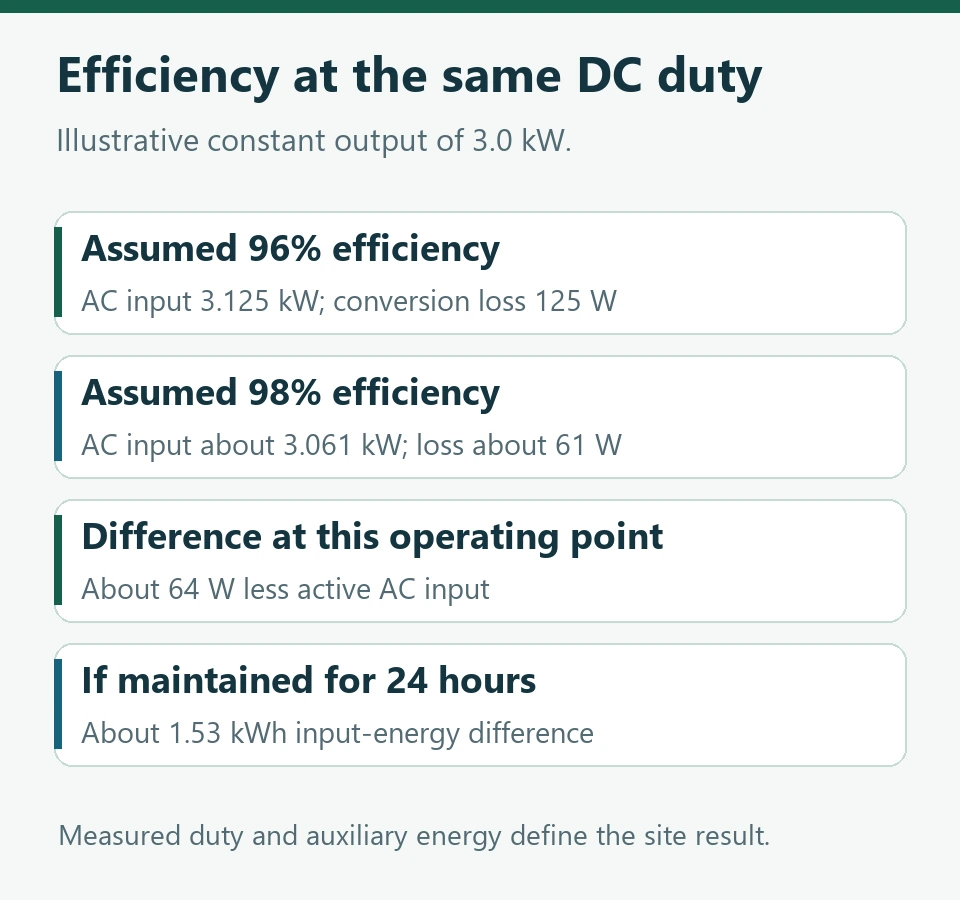
Take a module putting out a steady 3 kW DC. At 96% efficiency, active AC input is 3 ÷ 0.96 = 3.125 kW, so 125 W goes to conversion loss. At 98%, input drops to roughly 3.061 kW and the loss to about 61 W.
That’s a 64 W difference at this operating point. Hold it for 24 hours and the input energy differs by roughly 1.53 kWh. But this is arithmetic on paper — constant efficiency, constant output. Real savings depend on how the load actually moves through the day.
Where does this conversion stage sit in the plant? Huijue Group’s telecom rectifier system guide breaks it out into AC input, DC distribution and the battery branch. Use that layout to place your meters so the intended equipment is actually inside the boundary.
Look at how the modules spend the day
Efficiency isn’t fixed. It shifts with how hard the module is working and with input voltage; the output setting matters too. A site running several lightly loaded modules needs part-load numbers, not the peak figure on the datasheet. That peak tells you one point and nothing about the rest of the day.
Sleep modes are worth a look. They push output onto fewer modules and can change the whole loss profile. The catch is the controller: it still has to keep the load supplied and the batteries topped up, and respond when a source or module drops out. Check wake-up behaviour and spare capacity on your actual system before changing the strategy.
ITU-T L.1210 covers energy-efficient power feeding for IMT-2020 networks, including rectifier loading and managed operating modes. It’s a useful reference, but your claimed improvement still has to come from your own measured duty and the equipment you’re actually offering. ITU-T L.1210
Keep battery recovery inside the comparison
After a grid return, AC consumption spikes for a while. The plant is feeding the radios and refilling the batteries at the same time. Compare that stretch against a fully charged baseline and even an unchanged rectifier will look worse than it is. So match your periods on battery state and charging duty.
Solar muddies this further. PV can cover part of the DC load while the AC meter barely moves. Note where PV output crosses your boundary, otherwise you can’t tell whether the change came from better conversion, from the PV, or from a shift in demand.
Cooling needs the same care. Less heat from the converters should ease the thermal load, but how much energy the cooling actually saves depends on the controls and the weather, and on everything else warming the cabinet. If cooling savings are part of your case, measure them on their own.
A site result needs a baseline you can repeat
Pick a before-and-after pair where you’ve documented the load pattern, source availability, battery duty and ambient conditions. Check meter accuracy, fill the gaps in the data and note any changes to the radio configuration. Then integrate input energy over the window and compare it against declared service output, or whatever common basis you’ve chosen.
Now you can say what improved and by how much, within that boundary. A small loss reduction per module can add up across a large fleet. But if you’re making a site-wide claim, price the other effects separately instead of folding them into the rectifier number.
Huijue Group works on telecom energy equipment and integration. The figures here are labelled planning examples; the method is general engineering guidance.